ANALYTICS
Operational analytics: KPIs, performance and bottleneck detection
How many trucks waited longer than 45 minutes last week? Which crane generates the most rehandles? What share of delay sits at weighbridge versus validation? Which customer concentrates the exceptions? Most terminals cannot answer these questions without building a spreadsheet by hand. Essentos Analytics can.
It does not show monthly totals. It breaks down every indicator by cause, zone, shift, customer and period. The terminal stops debating what happened and starts seeing why it happened and how often it repeats.
Questions that now have answers
KPIs segmented by cause, zone, shift and customer
Monthly reports no longer require crossing multiple spreadsheets and emails
Patterns identified on the second occurrence, not after months of queues
From totals to understanding what slows the terminal
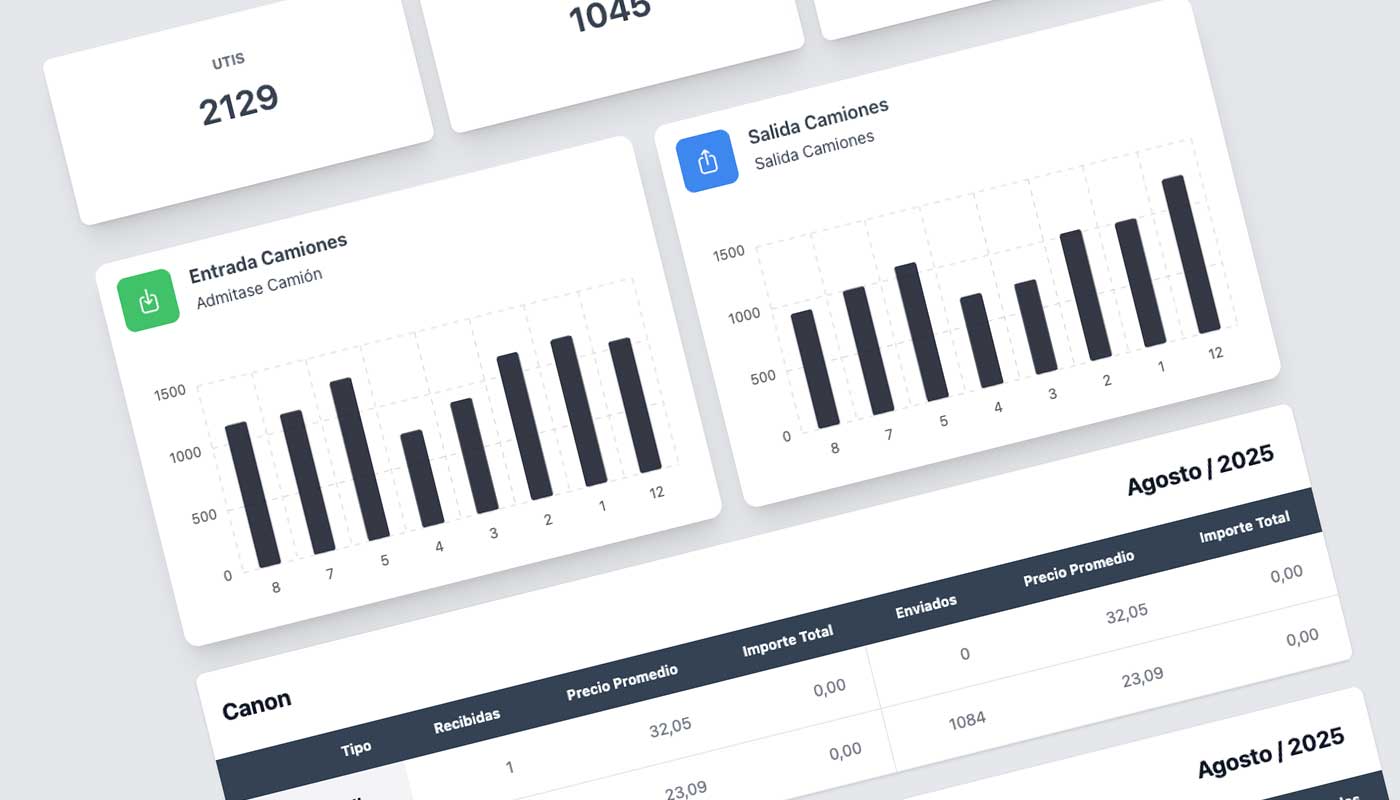
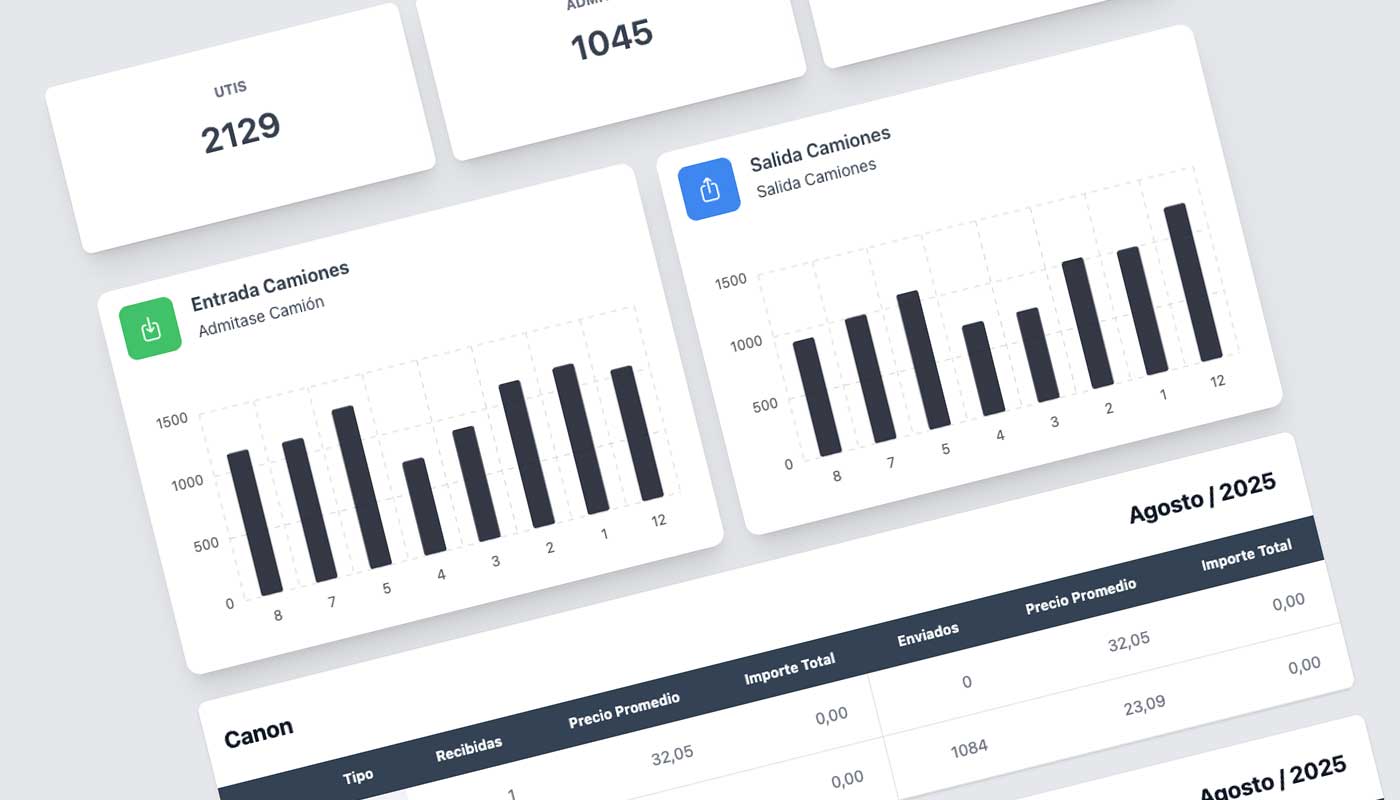
Why were there queues yesterday? Operations blames gate. Gate blames the yard. The yard blames weighbridge. Management asks for data and nobody has it ready. Three days later a report arrives with totals that explain nothing.
62 % of the extra time was concentrated in gate validation between 08:00 and 10:30, caused by incomplete documentation from three specific customers. The data was already available by 11:00 the same day, segmented by stage and customer.
The indicators that separate a terminal that reacts from one that anticipates
Each of these indicators marks the difference between a terminal that knows what is happening to it and one that only knows that something is happening:
-
Dwell time broken down by retention cause, cargo type and customer. Not just how long the unit stays, but why.
-
Truck turn time and gate cycle time segmented by stage: is the delay in validation, weighbridge, yard assignment or dispatch?
-
Yard pressure by zone and stacking height. The dashboard signals when occupancy approaches the limit, before the operation feels it.
-
Rehandles: where unnecessary moves repeat, what condition triggers them and how much they cost in accumulated time.
-
Stops between milestones: at what exact point the operation slows, how often and what factor triggers it.
Every month tells a different story. Analytics reads it for you
January was good. February worse. Why? Without breakdown, all you know is the numbers changed. With breakdown, you know exactly where, when and under what condition:
-
Did queues increase due to volume or because validation slowed after a process change?
-
Is yard zone B showing more pressure this month? Was it gradual growth or a one-off spike?
-
Do three customers account for 40 % of exceptions? Is it a pattern or a coincidence?
-
Is the problem at weighbridge, at dispatch, or in the coordination between both?
When an anomaly appears, Analytics shows the root cause and the comparison with previous periods. The operations meeting runs shorter and produces more concrete actions.
A process change is measured, not guessed
A weighbridge shift changes, a gate rule is added, the yard is redistributed. Did it work? Without data, nobody knows. With Analytics, every change has its measurable before and after:
-
Compare truck turn time before and after changing the weighbridge schedule.
-
See whether the new gate rule reduced the queue or just pushed it to the next stage.
-
Confirm that the yard zone redistribution lowered rehandles by a real 18 %.
-
Present management and the customer the same data, with the same context and the same basis.
Every operational decision stops being a bet and becomes an experiment with a measurable result.
Accuracy depends on the source: Analytics feeds from the operation, not from a spreadsheet
Indicators come directly from events the operation records: gate accesses, yard moves, execution milestones, weighbridge events, dispatches. No manual data entry. The better the terminal records its operations, the more precise and useful the analysis Analytics returns.
Frequently asked questions
What is a terminal KPI dashboard with dwell time and gate cycle time? ▾
A terminal KPI dashboard is a real-time view of the indicators that drive terminal performance: dwell time, gate cycle time, truck turn time, rehandles, shift productivity, yard occupancy and window compliance. Essentos Analytics builds it directly from the events recorded across gate, yard and execution, segmented by cause, zone, shift and customer.
How does Analytics measure operational performance at intermodal terminals? ▾
Performance is calculated from real operational events, not from manual entries: gate accesses, yard moves, execution milestones, weighbridge events, dispatches. Every indicator is broken down by stage, so the terminal can tell whether a delay sat in validation, weighbridge, yard assignment or dispatch, and confirm whether a process change actually improved the number.
Does Analytics work without the other Essentos modules? ▾
Analytics needs data from at least one operating module (Gate, Yard, Operations). The more modules are active, the more complete the breakdown and the cleaner the cause attribution.